What do fridges, cow farts and pig iron have in common?
Published: 12 Oct 2022

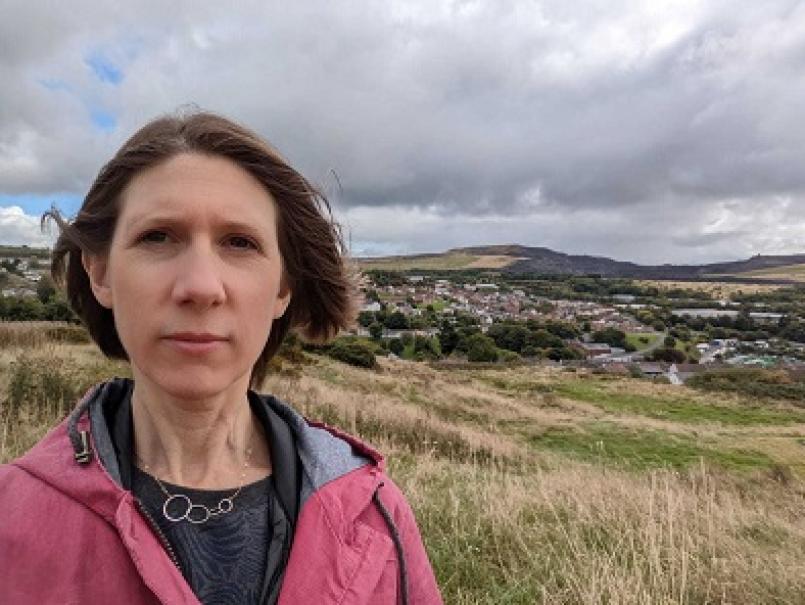
By Bleddyn Lake, Campaigns and Development Manager, Friends of the Earth Cymru
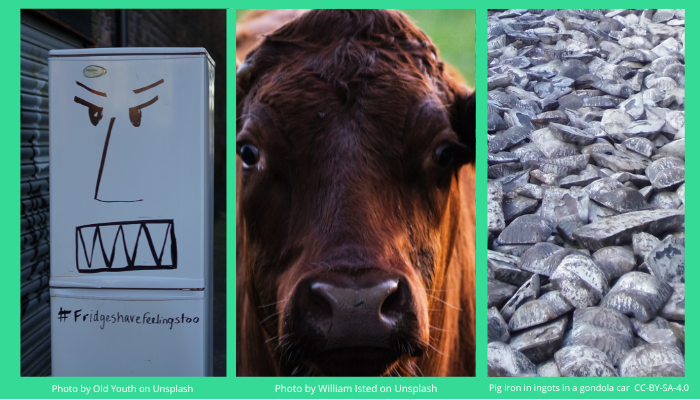
What do fridges, cow farts and pig iron have in common? Probably not an awful lot except that they all crop up in a list of Welsh Greenhouse Gas (GHG) emissions data.
Every year the National Atmospheric Emissions Inventory (NAEI) publish the latest GHG data for the UK. The latest set of figures came out last month. You can have a look via this link. It’s the ‘Greenhouse Gas Inventories for England, Scotland, Wales & Northern Ireland: 1990-2020’.
The NAEI is funded by the Department for Business, Energy & Industrial Strategy (BEIS), Department for Environment, Food and Rural Affairs (Defra), the Scottish Government, the Welsh Government and the Northern Ireland Department of Agriculture, Environment and Rural Affairs.
I know, I know…data…boring right? Well yes granted but in the fight against catastrophic runaway climate change we need to know where all our emissions are coming from and how they compare year on year. This will help us understand which sectors and which industries are doing well and which need to be doing a lot more.
Are there any surprises?
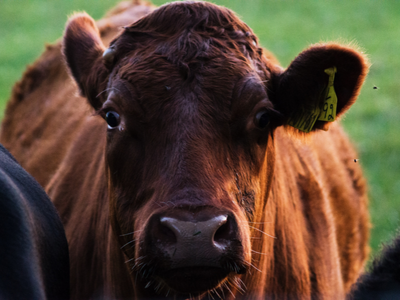
Well, near the top of the spreadsheet is ‘enteric fermentation’ of various animals. That’s burping and farting to you and me! This isn’t ground-breaking news but the actual figures are still surprising (in 2020 - dairy cattle = 877 kilo tonnes CO2 equivalent, non-dairy cattle 1307 and sheep = 1114). The CO2 equivalent (CO2e) thing is basically used as different GHGs are different in terms of their global warming potential, so methane for instance has a value of 25 which means that 1 tonne of methane has the same global warming potential as 25 tonnes of carbon dioxide.
A bit further down the list comes fertilisers (343kt CO2e).
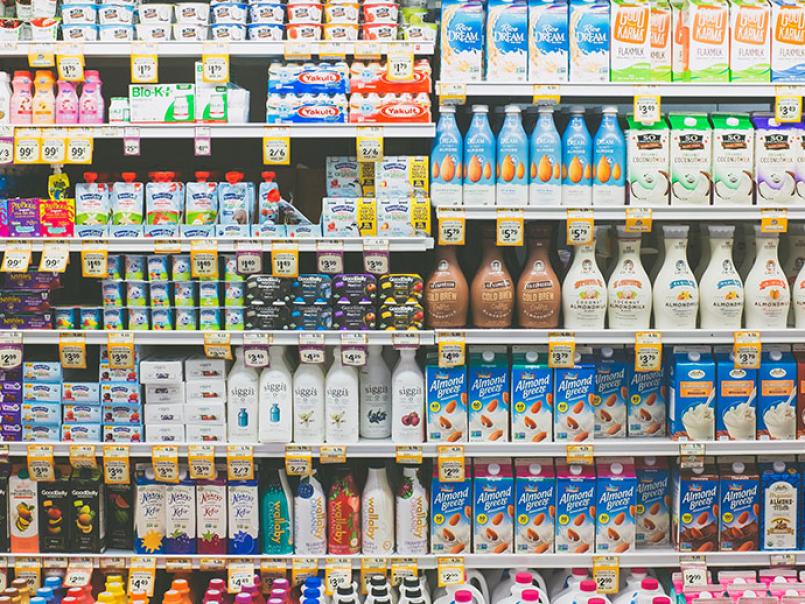
Commercial refrigeration (96kt CO2e) is also in the list and one that we have been campaigning on for a long time now in terms of supermarket fridges.
Emissions from air conditioning (110kt CO2e) have also been steadily increasing as the years tick by.
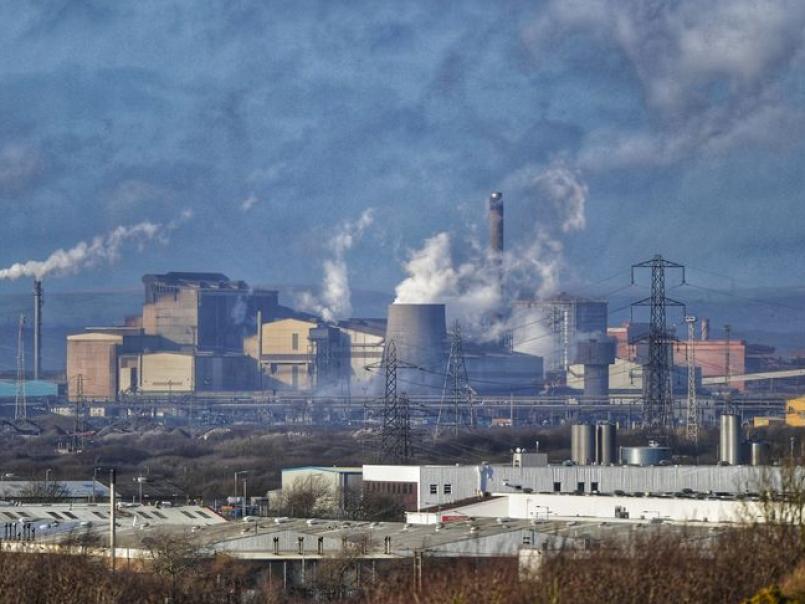
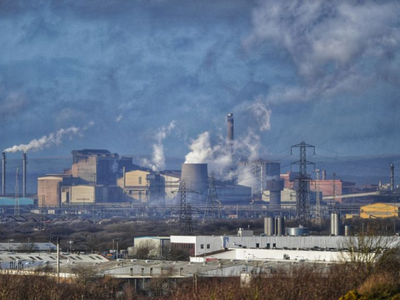
We see chemicals (various) here and the production of pig iron (4753 kt CO2e) also produces a lot of emissions. Then we are into some big emissions from public electricity and heat production (5236 kt CO2e) and petroleum refining (1729 kt CO2e) and then also, maybe somewhat surprisingly, emissions from abandoned underground mines (252 kt CO2e). The amount of methane given off by these old mines is really shocking.
Carry on down the spreadsheet and we meet another big emitter in the shape of cement production (517 kt CO2e). Cement manufacture is responsible for around 7-8% of worldwide climate emissions, meaning that if it was a country, it would rank third on the worldwide national climate emissions list.
And without going into too much detail, as you go down the list further you come across cars, trucks and buses, housing, landfills, and grassland converted to cropland.
Even inhalers crop up in the list as ‘metered dose inhalers’ with an emissions figure of 53.67 kt CO2e in 2020 which rather staggeringly is just shy of that for the oil and gas extraction industry in Wales (56.54 kt CO2e in 2020). The gases used in inhalers have very high global warming potential. Have a look at our Amdani pages for more information on how to dispose of them safely so their gases don’t leak out.
What are we asking for?
Last year our climate campaign volunteer Joe Cooke looked at NAEI emission data for industry and point sources (examples might be power stations, chemical factories etc) in Wales. You can read his blog here. The BBC also covered the issue.
As Joe mentioned in his blog last year and what our continued ask is – could we please have this climate emissions data presented nicely and published on the Welsh Government’s own website.
The data is of course already out there but it is just a bit of a nightmare to find and then, at least for point source emissions, it’s bundled up in UK level data so it’s difficult to see nicely and easily.
Stats Wales does publish some information on Welsh GHG emissions but even this isn’t as comprehensive a breakdown as the NAEI data we are discussing in this blog. As you can see from the links above, NAEI data goes into far more detail of where the emissions are coming from.
Stats Wales don’t (as far as I can see anyway) have any information of industrial point sources in Wales but this data is on the NAEI website.
Why is this important?
It’s all about transparency. In an era where more and more is expected of everyone in the fight against climate change, we should really be able to see what big business and big point source emitters are doing year on year to reduce their climate emissions.
Let’s be honest, how many people are going to go and find out who the NAEI are, let alone have a shufty through their data sets and then extract Welsh-level information from them? Not many!
Now simply publishing data won’t lead to any instant climate emission reductions, but it will give greater transparency which will hopefully lead to greater scrutiny and then hopefully to greater action.
Finally
While it is heartening to see emission reductions across so many different sectors and processes over the last 30 years, the figures do still show that we have a long way yet to go and that we need to increase the pace of emission reductions rapidly.
Transparency and scrutiny become ever more key as we move along now. We need to know which sectors are moving more rapidly than others - who are the pace setters and who are the laggards? We need to be able to see where more effort or more innovations are needed.
Working on the basis that more people knowing more about the situation increases the likelihood of action happening, then we would be delighted if Welsh Government agreed with our request to publish more comprehensive NAEI climate data and to also prioritise publishing the NAEI point source emissions lists for Wales each year. The data is out there but it seems to be doing its best to stay just that little bit too far out of the reach of most people.
It’s a small ask, an easy win and would increase transparency.